 Welcome to Day 17 of the 31 Days of iOS. Yesterday, we reviewed device orientation including how to detect when the orientation of the device changes and how to restrict what orientation a screen can appear in. Today we’re going to talk about how you can make use of the Debug Console. Compared to other integrated development environments (IDEs), Xcode leaves a bit to be desired when it comes to debugging an application. While many IDEs allow you to hover over a variable and see all of it’s properties whenever you hit a breakpoint, Xcode doesn’t really work this way. Thankfully, using the Debug Console, we can alleviate many of these issues.. We’ll be starting with a brand new project, but if you’d like to follow along with the completed code, you can access it here.
Creating our project
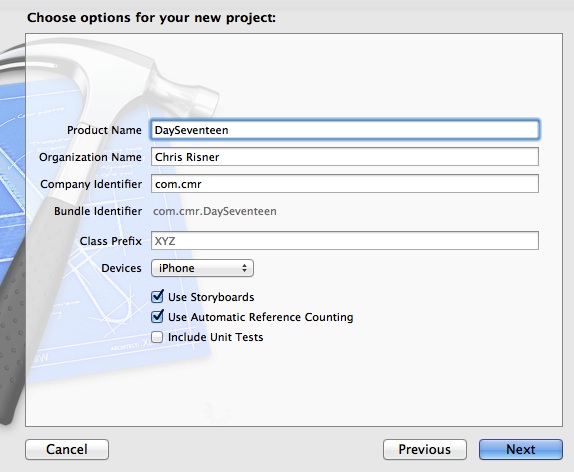
Open up Xcode and choose File, New, Project. We’ll use a Single View Application and name it DaySeventeen:

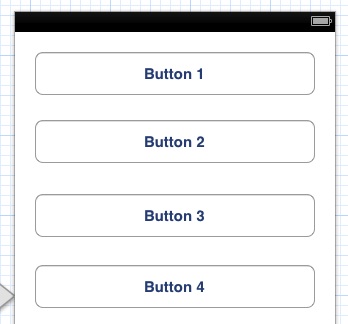
We don’t really need any UI in order to demonstrate how to use the Debug Console, but to make thing a little easier, we’ll add a few buttons to our user interface. Open the MainStoryboard.storyboard and drop four Round Rect Buttons onto the view. When you’re done, it should look something like this:

Now we can open the Assistant Editor in the top right of Xcode’s Utility Pane and control + click and drag from each button to the code behind to create actions. When you’re done, the ViewController.h should look like this:
Now let’s start using the Debug Console.
Our first NSLog statement
Open up the ViewController.m file and implement the tappedButtonOne method like so:
Now run your app and tap the first button. When you do so, you should see (provided the simulator is running on top of the Xcode window), that when you tap the button, a new panel comes up from the bottom of Xcode:

The section in the bottom right can be used for looking at variables when you’ve hit a brakepoint (we’ll look at this for a moment shortly). The section on the right is the Debug Console. Because we logged something from our code, the console automatically appeared. However, you can also open this manually by going to the View menu and choosing Debug Area and Activate Console. Also, you can tap command + shift + C and it will appear. Let’s look at logging something more complicated.
Logging objects
Similar to the NSString’s stringWithFormat method, we can put placeholders into our log string and then pass in objects or variables to be used to fill those placeholders. Let’s look at doing that now:
Here we’ve added another call to NSLog and passed the sender sent into the button tap action method as the parameter. Now when we run our app and tap button one, we see the original log statement and some more information:
2012-11-25 16:07:14.388 DaySeventeen[12698:c07] Hello debug console!
2012-11-25 16:07:14.390 DaySeventeen[12698:c07] Sender: <UIRoundedRectButton: 0x75426c0; frame = (20 20; 280 44); opaque = NO; autoresize = TM+BM; layer = <CALayer: 0x7542790>>
As you can see, the sender is the UIRoundedRectButton that we connected with the action method. The other information is relevant to the button, but doesn’t really mean a lot to us right now. One thing we’d like to see is that the text on the button is logged when we call NSLog. Let’s look at how to do that next.
Logging additional properties
When we logged the sender (which was a UIRoundedRectButton) it didn’t log the text of the button as we saw above. In order to facilitate getting the text out, we first need to cast the sender as a UIButton. Logging the UIButton as we did above leads to the same text being printed to the console. However, once the sender is cast, we can then access the necessary property to get the button text out:
Now when we run and tap button two, we should see this text printed to the console:
2012-11-25 16:19:30.736 DaySeventeen[12883:c07] Sender as button: <UIRoundedRectButton: 0x7432a80; frame = (20 88; 280 44); opaque = NO; autoresize = TM+BM; layer = <CALayer: 0x7432b50>>
2012-11-25 16:19:30.737 DaySeventeen[12883:c07] Button text: Button 2
However, one of the most powerful uses of the Debug Console is printing out expressions on the fly. Let’s do this now to print out the same text property without requiring a log statement.
Manually printing to the console
In order to get to a place where we can manually interact with the console, we need to add a breakpoint. We’ll do that now in the tappedButtonTwo method. We have a few different options to do this. We can place the cursor on the line we want the breakpoint and then tap command + \. We can put the cursor on the line and go to Product, Debug, Add Breakpoint at Current Line. Finally, we can click the area to the left of the line of code (where it shows the line number). Whichever method is used, once you’ve added a breakpoint, you should see a blue tag to the left of the line of code:

Now, when you run the app and tap button two in the simulator, execution will be paused and you will be returned to Xcode paused at the line you placed the breakpoint on. When you are at the breakpoint, you can click and place the cursor in the Debug Console right where it says lldb:

Once your cursor is in the console, you can type several things to get “on the fly” logging. Go ahead and type po button and hit enter in the console and you should see the following:
(lldb) po button
(UIButton *) $8 = 0x0713dab0 <UIRoundedRectButton: 0x713dab0; frame = (20 88; 280 44); opaque = NO; autoresize = TM+BM; layer = <CALayer: 0x713db80>>
(lldb)
po, short for print object, prints out a description of whatever object you pass in. However, we can also use po to print property information. Let’s continue to try to get the text of the button out by printing the titleLabel property of the button:
(lldb) po button.titleLabel
(UILabel *) $9 = 0x0713ecf0 <UIButtonLabel: 0x713ecf0; frame = (109 12; 61 19); text = 'Button 2'; clipsToBounds = YES; opaque = NO; userInteractionEnabled = NO; layer = <CALayer: 0x713dde0>>
Here, we get the description of a UIButtonLabel because the button actually has a label which is used to display the text on it. Much like printing the button, we get a lot of information that we might not need. However, this time we also get the text property. We could narrow this down even further by just printing the text property of the titleLabel:
(lldb) po button.titleLabel.text
(NSString *) $10 = 0x0713da20 Button 2
Note that we can also use the print command to print out similar information:
(lldb) print button.titleLabel.text
(NSString *) $11 = 0x0713da20 @"Button 2"
Why is that important?
As I mentioned earlier, Xcode doesn’t have very great support for viewing the status of a variable outside of the Debug Console. Let’s demonstrate this by using the same breakpoint above and then hovering over the button variable:

If we inspect the variables in the panel to the left of the console, we get a very similar lack of information:

So if you have a breakpoint in your code and need to get more information about a variable or an object, you can use the print statements in the console to print out information on the fly (without having to add a NSLog statement and restart your app) even though Xcode doesn’t show you very much information in the variable window.
Dictionaries and arrays
Let’s say we have an NSDictionary that we want to print out. We can use a NSLog statement like so:
However, we can print out the same information using a call to po:
(lldb) po dictionary
(NSMutableDictionary *) $4 = 0x07416e00 {
1 = value1;
2 = value2;
3 = value3;
}
(lldb)
However, if you try the print command here, it’s going to look a little different:
(lldb) print dictionary
(NSMutableDictionary *) $5 = 0x07416e00
(lldb)
The difference is in how these two commands work. po prints a description property where as print actually prints the location or value of whatever you’re passing in. We’ll look at that in more detail right after we look at printing out NSArrays. If we add a NSArray and a NSLog statement for it:
We’ll get the same output as if we use po on the array:
(lldb) po array
(NSArray *) $3 = 0x0ea27940 <__NSArrayI 0xea27940>(
item1,
item2,
item3
)
Logging custom objects
The last thing we need to look at is how to handle logging your own custom objects. To do this, let’s add a new class to our project first. Go to File, New, File and choose Objective-C class. Let’s name the class CustomObject and make it Subclass NSObject. We’re just going to add a few properties to the CustomObject.h file:
Now let’s go back to ViewController.m and use the CustomObject in the tappedButtonFour method (don’t forget to add an import statement for CustomObject.h):
Now if you run your app and tap button four, you might be saddened to see the output isn’t very informative:
2012-11-25 17:08:38.359 DaySeventeen[13522:c07] CustomObject: <CustomObject: 0x741d900>
Now you could put a breakpoint and manually print out the variable values like this:
(lldb) po customObject.name
(NSString *) $1 = 0x00004860 my object name
(lldb) po customObject.number
(NSNumber *) $2 = 0x07674210 42
(lldb)
But we don’t want to have to do that whenever we want information on the variable. Conversely, we could add NSLog statements for each variable or one statement with multiple placeholders, however, there is an easier way. When we use po we’re printing out the description property of a class. Let’s implement the description property for our custom object:
Now, when we run our app and NSLog is called with our customObject, we get something much more informative:
2012-11-25 17:13:49.844 DaySeventeen[13618:c07] CustomObject:
Name: my object name
Number: 42
Conclusion:
Today we looked at how to make use of the Debug Console. There are two different ways we can take advantage of the console: with NSLog statements and manually using the po and print commands. The console is incredibly powerful and allows developers to get on the fly information out about what’s going on in their application. While this is going to be the primary usage of the console, you can see the other uses and abilities of the console by using the help command. You can access the finished source code from today here.