
 Inevitably while working on an Android application, you’ll need to debug a problem. Today we’ll talk about how to handle those problems and debug your code. We’ll pick up where we left off yesterday in our 31 Days of Android series.
The first part of debugging we will cover is using breakpoints in your application. There are a few different ways to place a breakpoint in your application. First, select the line of code you’d like to put a break in and either: hit Ctrl+Shift+B, or go to Run—>Toggle Breakpoint, or double click in the blue column to the left of the line in the Eclipse code editor. In order to get the code to stop executing at your breakpoints, you need to debug your app instead of running it. To do so, click F11 or right click your project and go to Debug As—>Android Application. Now your application will pause whenever it reaches a breakpoint. Once this happens you can highlight variables to see what their values are or you can use the Variables and Expressions tabs in Eclipse.
When your breakpoint is reached for the first time, Eclipse will pop up a window confirming that you want to switch Perspectives to the Debug perspective. When this happens, say yes and you’ll be taken to a window which shows the callback stack, console, code view, and a tab (in the top right) with variables. Variables will show you the values of all available variables and allow you to expand complex types to see their values. In addition, if you go to Window—>Show View—>Expressions you’ll launch the expressions window. Expressions will allow you to enter variable statements as well as assign values to variables on the fly. Both of these windows are very useful for figuring out what is happening in your code.
Next we’ll talk about a very useful logging tool, Logcat. In Eclipse, go to Window—>Show View—>Other and look for Logcat. This will launch the Logcat window in the bottom of Eclipse:

On the right you’ll see all the messages logged by the emulator we’re currently running or the currently connected device. On the left we can set up filters so that we only see certain messages. It’s great that we can see the messages, but let’s talk about how to actually log them:
Log.i("DaySevenActivity", "This is an info message");
Log.e("DaySevenActivity", "This is an error message");
Here we’re logging an Info message and then an Error message. These will then show up in Logcat as a green and red message, respectively. This is a great way to quickly and easily get incite into what’s happening in your app and what code is being reached. Just a warning, you’ll want to set up a filter because the emulator will log a lot of messages that don’t have to do with your app and an actual device will log many more.
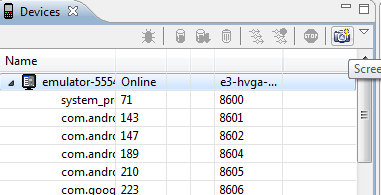 The last piece on debugging we’ll go over today is DDMS. In Eclipse go to Window—>Open Perspective—>Other. Chose DDMS and open it. This will open the DDMS perspective and in the future, you can switch back and forth between the Java, Debug, and DDMS perspectives in the top right of Eclipse. DDMS enables you to switch between the emulators you are running and the devices you have connected, trigger incoming phone calls, view Logcat, and more. In the top left, you can switch between emulators and devices as well as take screenshots of apps running on both the emulators and devices.
With all of these toosl at your disposal, you should now be capable and prepared to debug your Android applications.
